In this tutorial, we build a minimal tight-binding model for monolayer MoS2 using three Wannier functions. The goal is to reproduce the most important bands near the band gap. These bands are the valence-band maximum, the conduction-band minimum, and the next conduction band:
$$\text{VBM}, \quad \text{CBM}, \quad \text{CBM+1}$$
At first sight, one may ask: why exactly these three bands? Why not use only two bands, VBM and CBM? Or why not include many more bands?
The answer is that VBM, CBM, and CBM+1 form a compact and physically meaningful low-energy manifold for monolayer MoS2. This three-band set is small enough to be simple, but still rich enough to capture the dominant orbital physics near the band gap.
The VBM and CBM are the most obvious bands to include. The VBM is the highest occupied band, and the CBM is the lowest unoccupied band. Together, they define the fundamental electronic band gap:
$$E_g = E_{\mathrm{CBM}} - E_{\mathrm{VBM}}$$
If we are interested in low-energy electronic excitations, optical transitions, excitons, or transport near the band edge, these two bands are essential. The transition from VBM to CBM is the simplest electronic excitation across the gap.
However, in monolayer MoS2, a model containing only VBM and CBM is often too limited. The reason is that the band-edge electronic structure near the K and K’ valleys is not naturally described by only two atomic orbitals. Instead, the relevant low-energy states are mainly formed by three molybdenum d-orbitals:
$$d_{z^2}, \quad d_{xy}, \quad d_{x^2-y^2}$$
These orbitals are centered on the Mo atom and dominate the electronic states close to the gap. In a minimal Wannier description, each of these orbitals corresponds to one Wannier function. Therefore, three physically important orbitals naturally lead to a three-band tight-binding model.
In this model, the conduction-band minimum near the K point is strongly associated with the $d_{z^2}$-like orbital character. The valence-band maximum near K is mainly formed from combinations of $d_{xy}$ and $d_{x^2-y^2}$-like orbitals. The next conduction band, CBM+1, also belongs to the same Mo-d-dominated manifold. Therefore, if we want to describe the low-energy Mo d-orbital physics consistently, we should include not only VBM and CBM, but also CBM+1.
This is the main reason why the three-band model is a natural minimal model for monolayer MoS2:
$$
3 \text{ important Mo } d\text{-orbitals}
\quad \Rightarrow \quad
3 \text{ Wannier functions}
\quad \Rightarrow \quad
3 \text{ bands near the gap}.
$$
The role of CBM+1 is especially important conceptually. Even if the lowest optical transition is mainly associated with VBM $\rightarrow$ CBM, the nearby CBM+1 band can still influence the physics through orbital mixing, band curvature, symmetry, optical matrix elements, Berry curvature, and other geometric properties. In other words, CBM+1 is not included only because it is “another band nearby.” It is included because it is part of the same minimal orbital structure.
This is also why the ordinary band structure alone is not enough to justify the choice of Wannier projections. The band structure tells us the energies of the bands and helps us identify which bands are close to the gap. But it does not directly tell us which atomic orbitals form these bands. To choose Wannier projections properly, one should also inspect the orbital-projected band structure or the projected density of states.
For example, in Quantum ESPRESSO, this can be done using projwfc.x. This calculation allows us to see whether the target bands are mainly Mo d-like or S p-like, and which specific orbitals contribute most strongly. For monolayer MoS2, such an analysis shows that the states near the gap are dominated by Mo d-orbitals. In particular, the figure below shows the combined contribution of the three Mo orbitals used as the initial Wannier projections,
begin projections
Mo:dz2
Mo:dxy
Mo:dx2-y2
end projections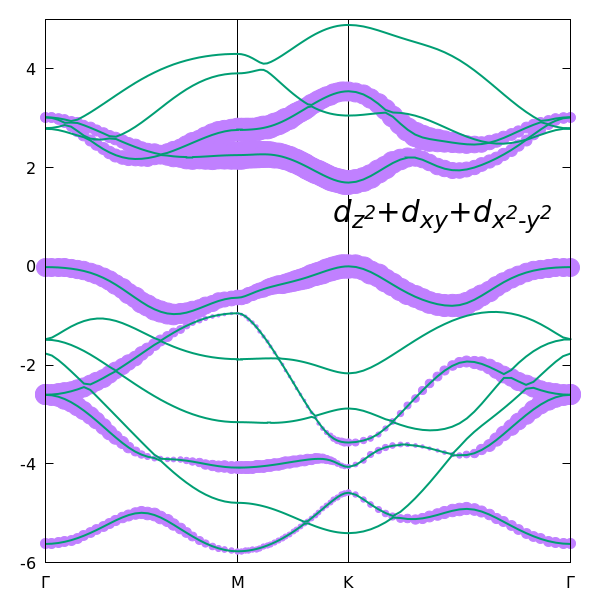
while the following figure shows the combined contribution of the two remaining Mo d-orbitals, $d_{xz}$ and $d_{yz}$.
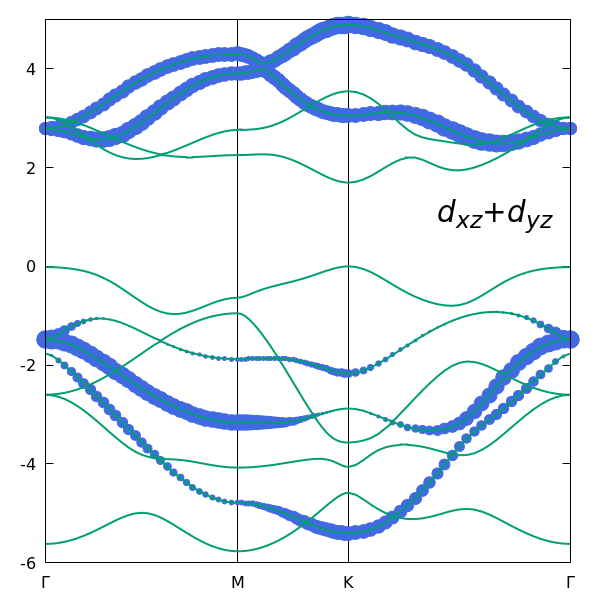
The comparison demonstrates that the bands near the gap are predominantly formed by the $d_{z^2}$, $d_{xy}$, and $d_{x^2-y^2}$ orbitals, providing a clear physical justification for choosing these three orbitals as the initial projections.
How to plot these figures see here.
A two-band model containing only VBM and CBM may be useful for very simple analytical discussions. It can describe the existence of the band gap and the lowest transition across the gap. However, it loses part of the orbital structure of the Mo d-manifold. As a result, it may give a less reliable description of the band dispersion away from the immediate band edge and may miss important symmetry and orbital-mixing effects.
On the other hand, one can also build a larger model by including additional orbitals, for example other Mo d-orbitals or sulfur p-orbitals. Such a model may be more accurate over a wider energy range, but it is also more complicated and less transparent. For a first Wannier90 tutorial, the three-band model is a good compromise: it is simple, physically motivated, and easy to analyze.
Thus, the choice of VBM, CBM, and CBM+1 reflects the main philosophy of Wannier modeling. We do not want to include as many bands as possible. Instead, we want to include the smallest number of bands that still captures the essential physics. For monolayer MoS2 near the gap, this smallest useful set is formed by three Mo-d-dominated bands: VBM, CBM, and CBM+1.
The final practical message is: VBM and CBM define the band gap, while CBM+1 completes the minimal three-orbital Mo d manifold.
Therefore, VBM, CBM, and CBM+1 provide a compact and physically meaningful target space for constructing a three-Wannier-function tight-binding model of monolayer MoS2.